Citation.Problems of Moscow University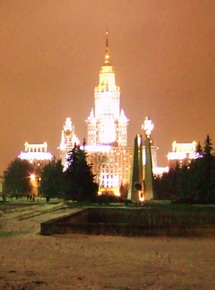
Light design of the main building of Moscow University in 2007. Note the colour of the night sky in Moscow city. Sternberg Institute's official letter, February, 1999. To Luzhkov Yury Mikhailovich, the Mayor of Moscow city (On the interference to astronomical observations at the Moscow University territory). Dear Yury Mikhailovich! The Sternberg State Astronomical Institute and its Observatory are located in the Vorobyev Hills near the crossroad of University prospect and Vernadsky prospect. Here, the scientific researches and the astronomical observations are performing, and teaching of studends and experts for the astronomy and alied trades as well. In the last 50-ies, the big 70-cm telescope (being third in Russia arranged by mirror diameter), and four smaller telescopes were installed. They are used now for the observations at night. In the last 1998 the unknown commercial advertising firms installed the billboards illuminated at night, what increased the level of sky light pollution and interference to astronomical observations. Unfortunately, they do not keep the generally accepted international engineering standards by international ecological organizations against light pollution. The commercial billboard to sail Beefeater alcohol drink installed near children's theater is illuminated bottom-up, so as the most light goes in the sky. Similarly illuminated billboard for Coca-Cola near the circus pollutes the sky by light ten times stronger, such objects should be installed non less than 15 km away from a working observatory. Moscow University does not have finance funds to take the telescopes out of the city and capital development, and therefore we should care of the environment for astronomical observations in the city. Till now, the astronomical observations at the Vorobyov Hills were successful due to clearness of the air, and due to measures taken to remove the sources of light pollution on the territory of University. Please, give the orders to limit the activity of commercial advertising firms near the crossroad of University prospect and Vernadsky prospect, and to reconstruct the installed billboards according to present standards with the illumination from top to down. Sincerely yours, A.M.Cherepashchuk, Corresponding member of the Russian Academy of Sciences, Director of Sternberg Astronomical Institute. Continued |
Observations of relative intensities of HgI and NaI emission lines
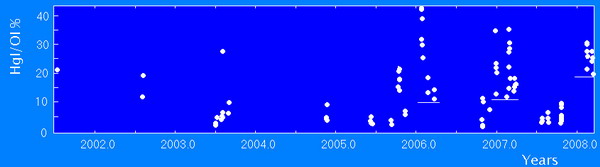
The seasonal variations of HgI 5460A line relative intensity are shown in Fig. 4. The period of increasing pollution is marked here with a light background band. The increasing light pollution is seen since middle December till end of March. This is the time when the snow cover appears in Nizhnyj Arkhyz and surrounding highland villages. One can note that the midline of this period is shifted relative to December 22, the date of winter solstice. This means that the maximum of HgI/OI ratio is not connected with the seasonal weakening of [OI] line due to deep location of the Sun under horizon, but namely with the mercury emission and with the reflection of city lights from snow cover. Additionally sky pollution increases due to absence of leaves on the trees. 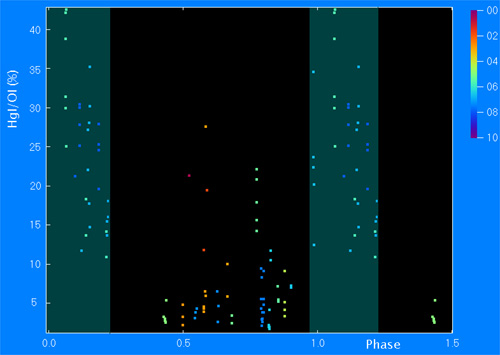 The temporal variations of NaI/[OI] intensity ratio are shown in Fig.5. NaI line is a blend of two components 6A distant by wavelength. They are resolved in some spectrograms. As the central intensity of lines was measured, these few measurements are referred to brighter short-wave component, so the intensity of the blend is underestimated. The behaviour of NaI line resembles this one of HgI line. Total range of this line variation is twice as large as HgI range. Its ratio varies between 2 and 91 per cent, i.e. 45 times. The increasing of pollution level in winter due to snow cover is notable, too. In the season of 2008, minimum level of this ratio is 42 per cent, what is twice larger than in the previous season. The growth of the light pollution by this line from season to season is sharper than in HgI line. 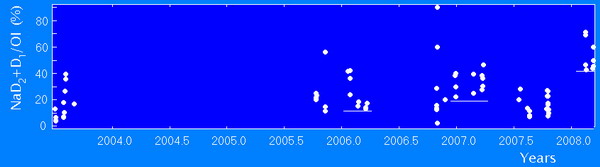
The seasonal variations of of sodium line relative intensity are shown in the Fig. 6. High light pollution was observed not only in winter, but in Summer and Autumn seasons, too. The record value of 91 per cent was reached on the night of 2006 November 30 during the observations of CI Cam, the 12 mag star. There is a record in the journal of observations that the observations were done with clouds on the sky. This is a prime evidence that the light pollution by mercury and sodium emission increases due to scattering city lights on the aerosol and nebulosity in the lower layers of the atmosphere. 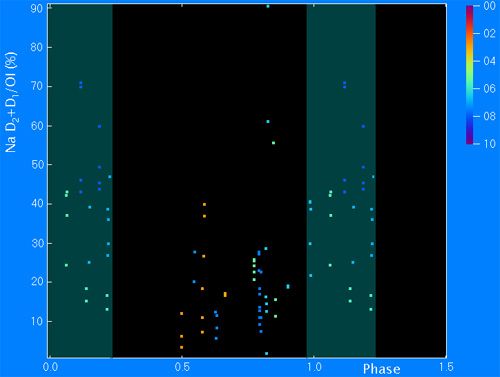
The dependence between relative intensities of mercury and sodium is shown in the Fig. 7. This was drawn including only those spectrograms where both lines, HgI and NaI are visible. This is a weak dependence. For example, when the intensity of HgI is 5 per cent of [OI], the relative intensity of NaI varies in the range between 6 and 37 per cent. Newertheless, as mean at the low level, HgI line intensity increases so as NaI with the proportion 1 : 1. This means that the artificial component of NaI contributes about the same light amount as this one of HgI emission. 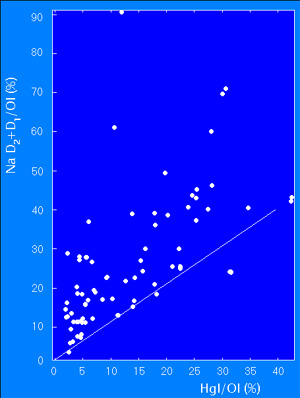
Continue: Night sky spectrum of the Special Astrophysical Observatory. Observations of relative intensities of HgI and NaI emission lines Characteristics of interference due to light pollution at the SAO observational sight. Light pollution sources-1. Light pollution sources-2. Results and conclusions. Continued. Monitoring the situation. THE WATER-BOTTLING PLANT IS STARTED-UP IN THE CENTER OF LIGHT-PROTECTED ZONE OF 6-METER TELESCOPE. |